Last updated: October 27, 2026. By the TheBodyVisualizer team.
Two people can both weigh 150 lbs and look like they belong to different weight classes. That gap is what people mean by same weight, different body composition: the scale reports one number, while the body underneath is a mix of fat, muscle, bone and water, arranged in a shape that is partly your own.
TheBodyVisualizer is an online body visualizer that shows how your body could look at a goal weight, on an adjustable 3D body model and on your own photo with the same face, hair and outfit. We wrote this post because our 3D body visualizer lets you hold height and weight fixed and change only body shape or muscle level, which is the cleanest way we know to show this effect. Below: what research says about that gap, why BMI misses it, and how to compare bodies at a fixed weight.
Why Does the Same Weight Look Different on Two Bodies?
The same weight looks different on two bodies because body weight is a total, and two totals of 150 lbs can be built from different amounts of fat and muscle, stacked on different frames, with fat stored in different places. A scale cannot separate those parts. Height is the first variable: 150 lbs on a 5'2" frame spreads over less length than 150 lbs on a 5'10" frame. Composition is the second: how much of that 150 is fat versus lean tissue. Distribution is the third: whether stored fat sits around the waist or around the hips and thighs.
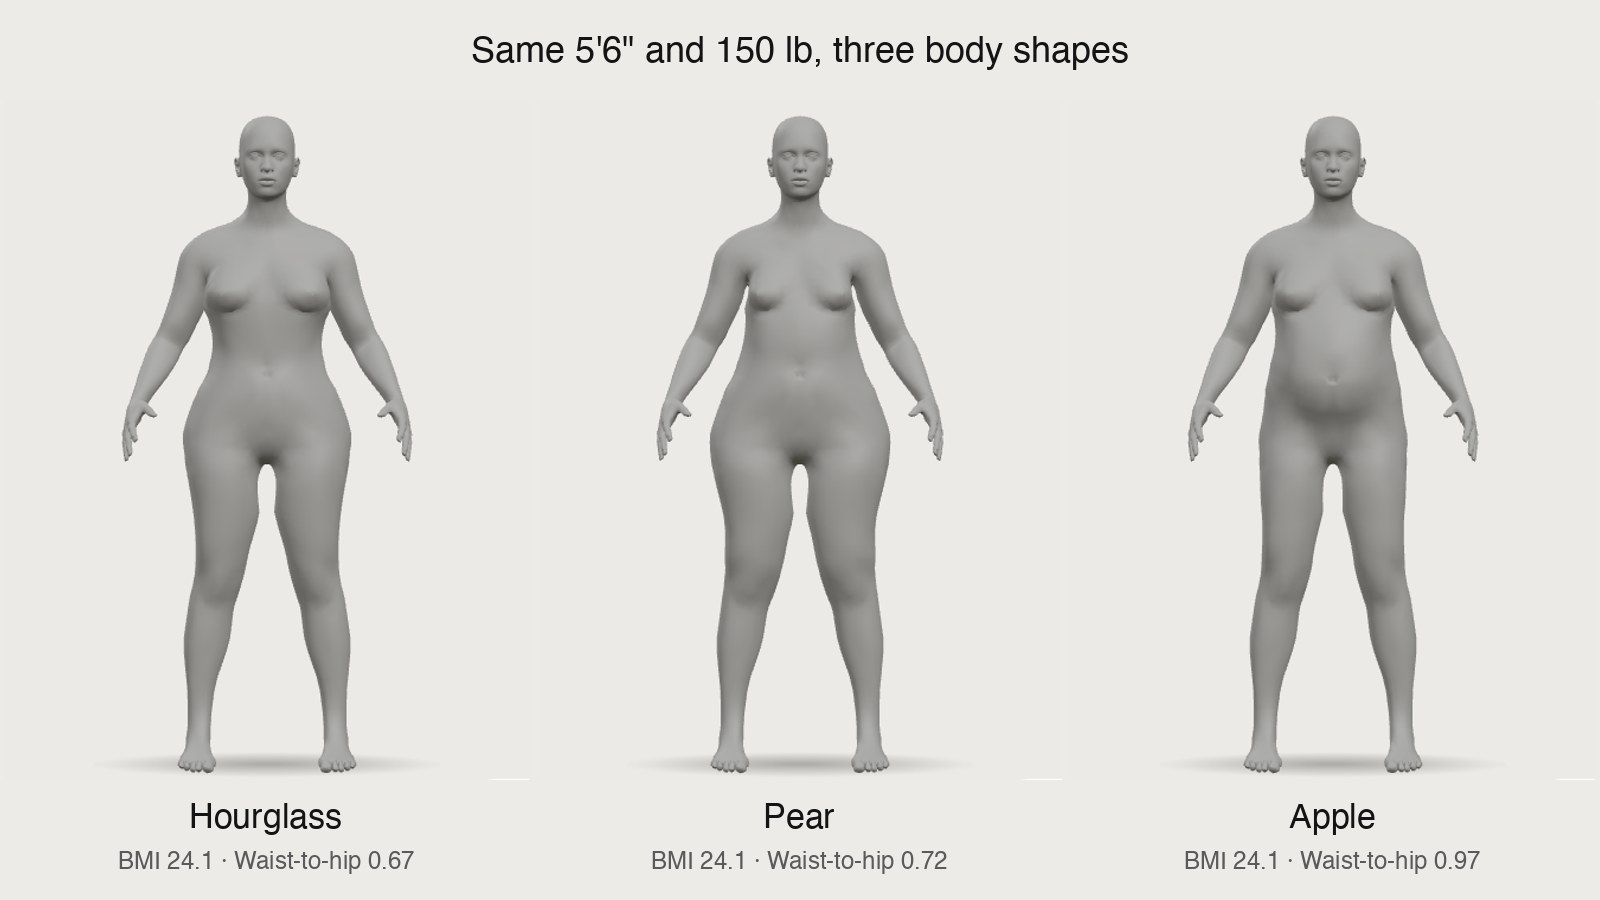
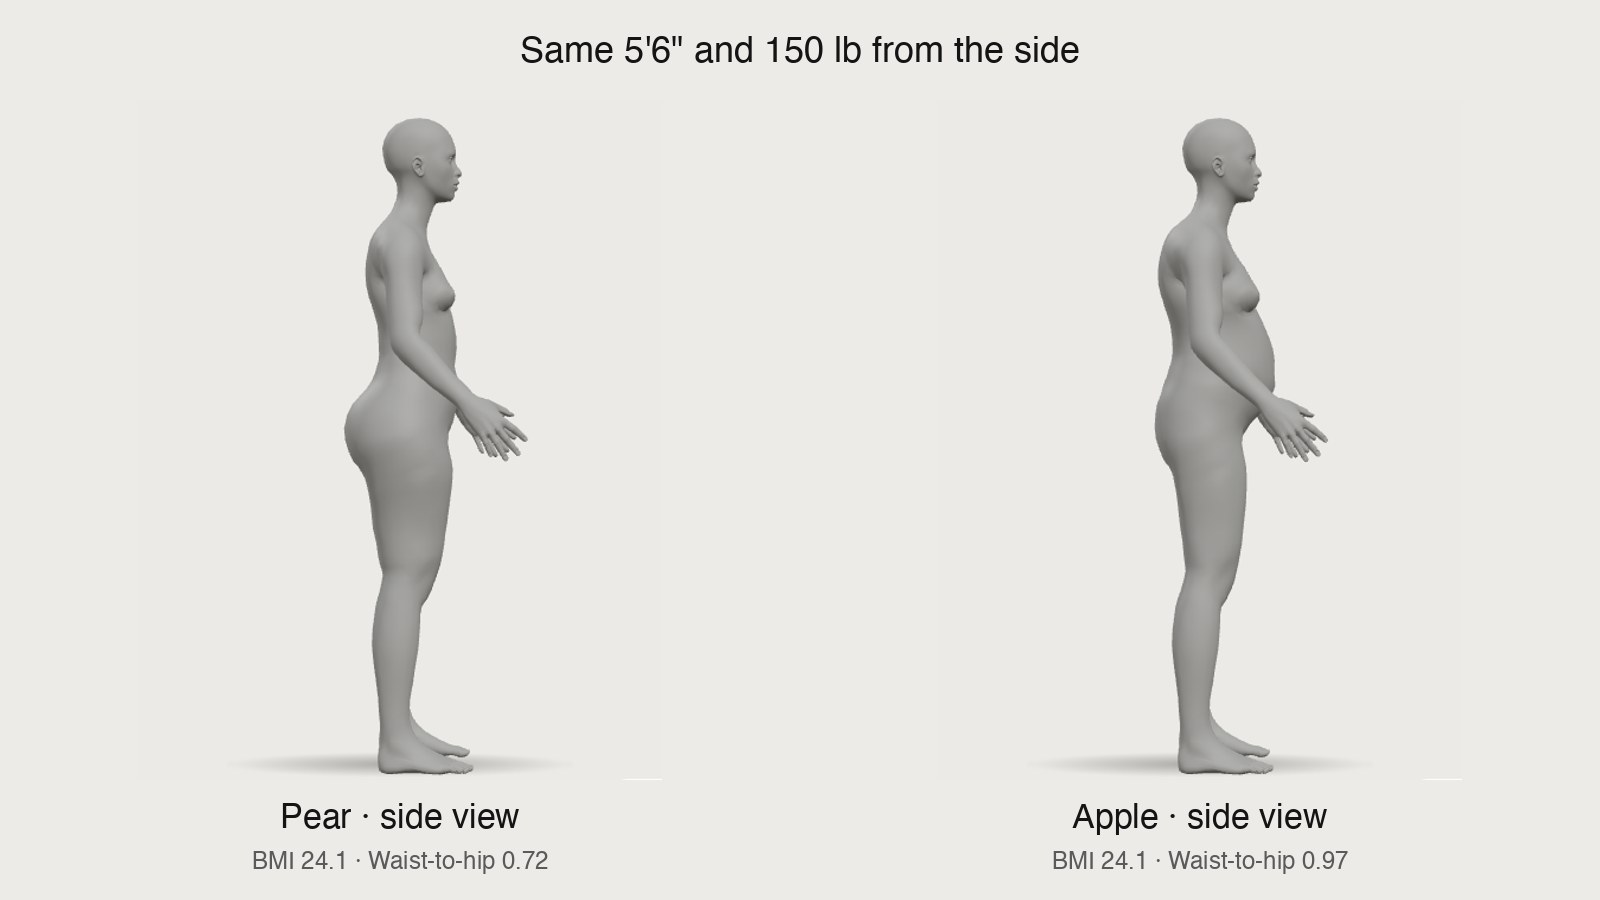
Most articles stop at composition and show a "muscle vs fat" photo pair. In our 3D tool, a 5'6", 150 lb model set to Apple and the same model set to Pear carry the same weight in different places, and their BMI readout is identical.
Same Height, Same Weight, Different Body Fat: What the Research Shows
Research on adults of the same height shows that weight differences between them are mostly fat. In a random sample of Danish adults aged 35 to 65, Heitmann and Garby compared 548 men and 498 women grouped by height and measured how body fat related to lean mass (everything that is not fat) (Eur J Clin Nutr, 1998). For every extra kilogram of lean mass, the heavier women carried about 2.88 kg more fat and the heavier men about 1.84 kg more fat. The pattern held across all height classes.
In plain terms: when two women of the same height differ in weight, roughly three quarters of the difference tended to be fat; for men, roughly two thirds. That is a population average, not a rule for any one person, which is why two people at the same height and weight can still sit at different body fat levels. One may carry more lean mass and less fat, the other the reverse, and the scale shows both the same number.
Why Muscle Takes Up Less Room Than Fat
Muscle takes up less room than fat at the same weight because lean tissue is denser. The standard two-compartment method for measuring body composition assumes lean mass has a density of 1.100 kg per liter, and Visser and colleagues found that assumption held across 703 Black and white adults aged 20 to 94, including older and higher-BMI participants (Am J Physiol, 1997). Fat is less dense than lean mass, and underwater weighing works by measuring that difference.
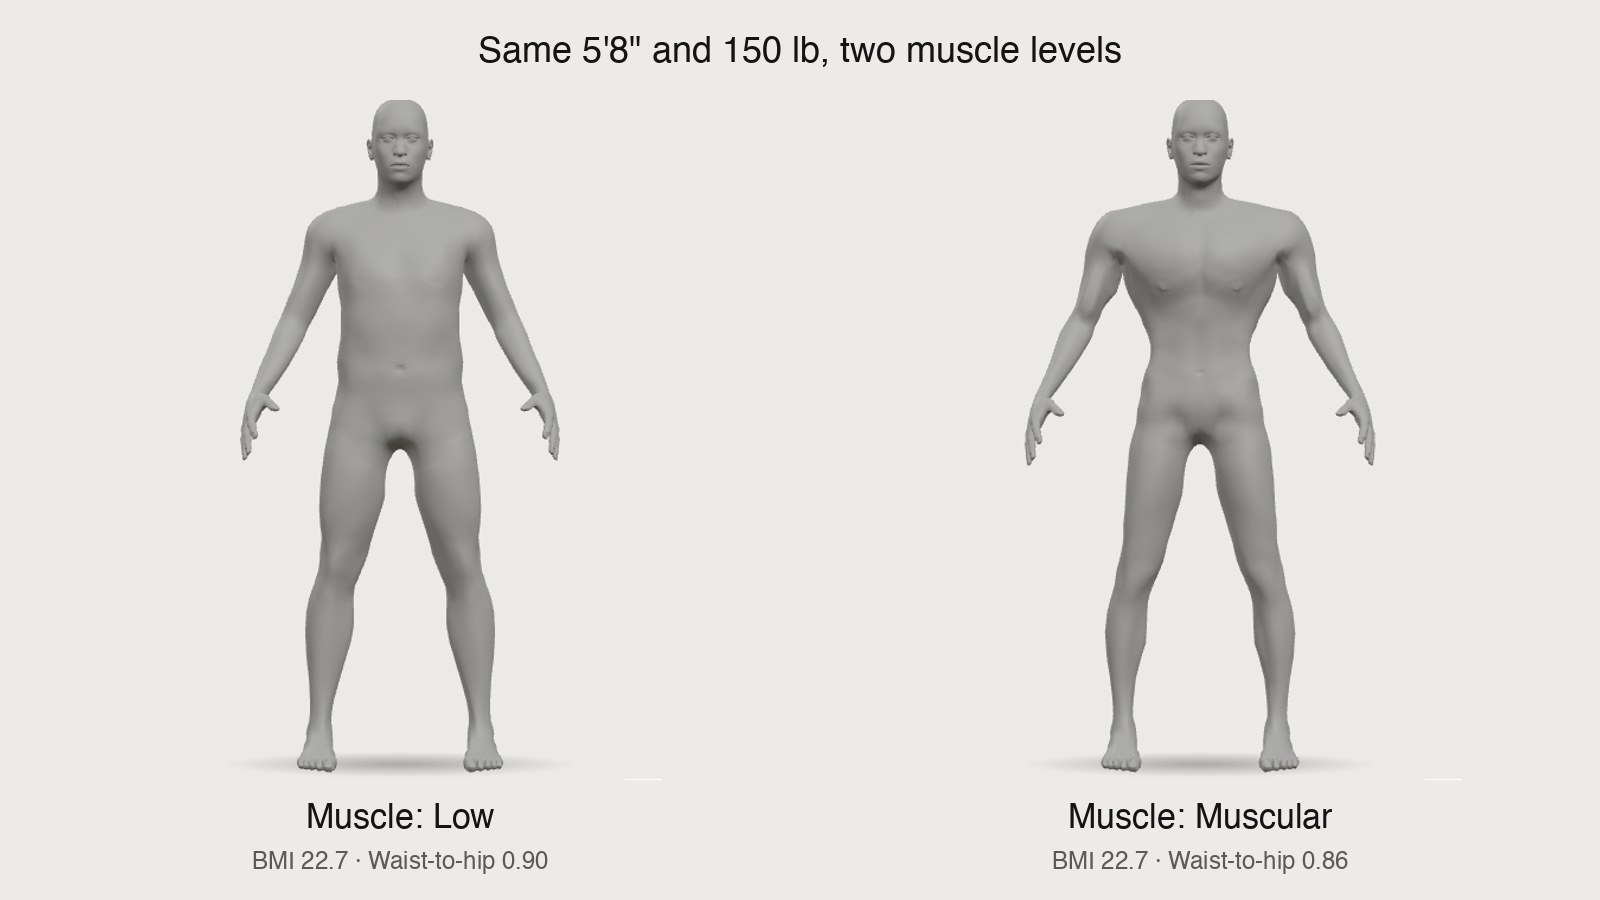
So a pound of fat and a pound of muscle weigh the same, but the pound of fat fills more volume. A body with more lean mass at 150 lbs will often measure smaller around the waist and limbs than a body with more fat at 150 lbs. Our 3D tool reflects this through its Muscle setting (Low, Average, Athletic, Muscular): at a fixed height and weight, moving up the scale narrows the waist and adds shape to the shoulders, chest and arms.
One caution from the ISSN position stand on diets and body composition: all body composition assessment methods have strengths and limitations. Smart scales, calipers and scans each estimate body fat with some error, so treat any single reading as an estimate.
Where Fat Sits: Hourglass, Pear and Apple at the Same Weight
Fat distribution is where the same amount of body fat is stored, and it changes the outline of a body more than most people expect. The CDC notes that BMI does not tell you "where in the body that people carry fat" (CDC, About BMI). Waist-to-hip ratio is one way health researchers describe distribution; the WHO convened an expert consultation specifically on waist circumference and waist-hip ratio (WHO, 2011).
Here is how the three body shape presets in our tool redistribute the same weight on the female model:
| Shape preset | What the 3D model changes | Height, weight, BMI |
|---|---|---|
| Hourglass | Narrower waist, fuller bust, hips and glutes | Unchanged |
| Pear | Wider hips and fuller thighs and glutes, narrower shoulders and bust | Unchanged |
| Apple | Wider waist and belly, narrower hips and thighs | Unchanged |
The tool also shows an estimated waist-to-hip ratio next to BMI. When you switch from Pear to Apple, BMI stays put and the waist-to-hip number moves. If you enter your own measurements under "More measurements", the model follows them, and once both waist and hips are entered the ratio is no longer marked as estimated. For a closer look at shape on the female model, see our female body visualizer.
Why BMI Gives Both Bodies the Same Label
BMI gives two bodies the same label because it is calculated from height and weight only. The CDC states that BMI "does not distinguish between fat, muscle, and bone mass" (CDC, About BMI). For adults, the CDC categories are:
| BMI | CDC category |
|---|---|
| Below 18.5 | Underweight |
| 18.5 to 24.9 | Healthy weight |
| 25 to 29.9 | Overweight |
| 30 or above | Obesity |
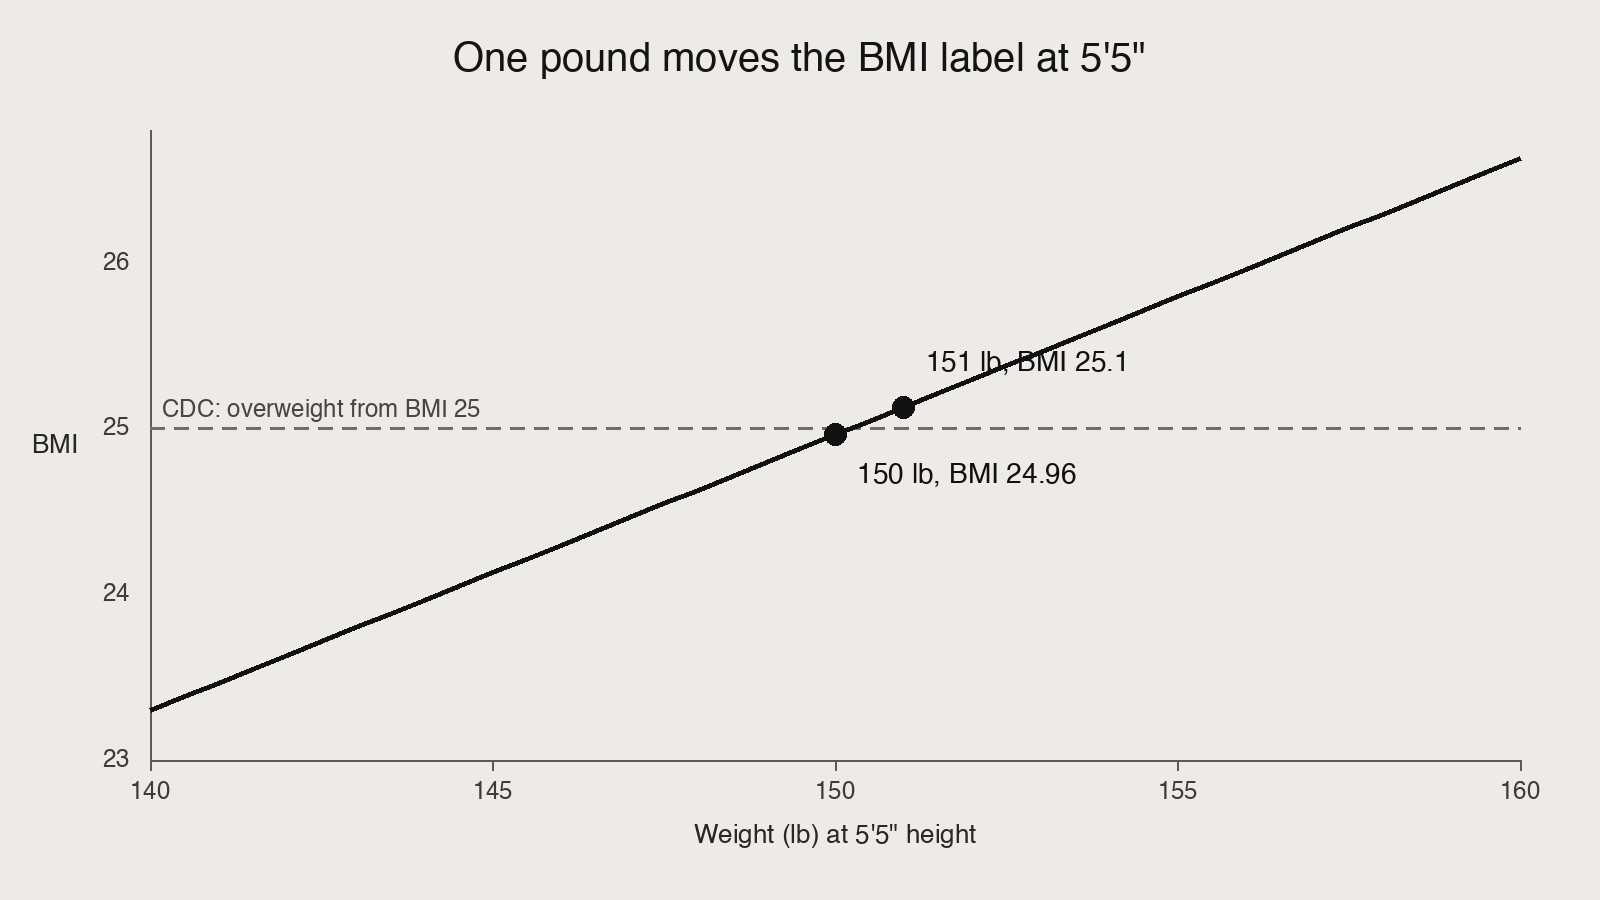
These cut-offs are lines on one number. At 5'5", 150 lbs works out to a BMI of 24.96, inside the healthy range; 151 lbs is 25.1, in the overweight range. One pound moved the label, and nothing about the body's shape or makeup changed.
The limitation shows up in large samples too. Romero-Corral and colleagues analyzed 13,601 US adults from NHANES III (Int J Obes, 2008). A BMI of 30 or more rarely flagged someone without excess body fat, but it missed more than half of the people whose body fat percentage was in the obese range. In the 25 to 29.9 band, BMI could not tell body fat from lean mass in either men or women. The CDC calls BMI one health indicator to weigh with other factors.
How We Compare Same-Weight Bodies in 3D
We compare same-weight bodies by fixing height and weight in the 3D tool and changing one setting at a time. Here is the setup we used for the screenshots in this post:
- Open the 3D body visualizer and choose Female or Male, then ft / lb or cm / kg.
- Enter the height and the weight you want to hold constant, for example 5'6" and 150 lbs.
- Set Goal weight equal to current weight, so the readout shows "Now = Goal".
- On the female model, switch Body shape between Hourglass, Pear and Apple. On either model, switch Muscle between Low, Average, Athletic and Muscular.
- Use the Front, Side and Back views, and watch the BMI and waist-to-hip readouts.
The two settings act on different areas: body shape presets move the waist, belly, hips and thighs, which the Side view shows clearly, while the Muscle setting mostly adds to the arms, chest and shoulders. The 3D model is a simulation built from your numbers, not a scan. If you want to see a goal weight on yourself, the photo preview keeps your face, hair and outfit, but it works from your height, current weight and goal weight only. It does not read body shape presets or bust, waist and hip measurements, so shape comparisons belong in the 3D tool.
Can Your Body Change Shape Without the Scale Moving?
Your body composition can change while your scale weight stays roughly flat, because fat and lean mass can move in opposite directions. The ISSN position stand on protein and exercise states that resistance exercise and protein intake both stimulate muscle protein synthesis and work together when protein is eaten around training. The ISSN position stand on diets and body composition adds that a wide range of dietary approaches can be similarly effective for improving body composition, and that long-term results depend on sticking with the plan.
We are not giving intake targets or a program here; both position stands are written for exercising adults, and a doctor or registered dietitian can apply them to your situation. How fast and how much composition changes varies between people. What the 3D tool can do is show the end points side by side: the same weight at Average and at Athletic muscle, so you can see which direction the outline moves.
FAQ: Same Weight, Different Body
The short answers: body composition tells you more than weight alone, and two people with the same BMI can carry different amounts of body fat.
Is body composition a better health indicator than weight?
Body composition adds what weight alone lacks: how much of the total is fat and where it is stored. The CDC recommends looking at BMI alongside other factors, including muscle mass, rather than on its own. Every measurement method carries error, so trends over time from the same method are more useful than a single reading.
Can two people with the same BMI have different body fat?
Yes. BMI uses only height and weight. The NHANES analysis found that BMI missed more than half of adults with high body fat percentage.
Same Weight, Different Body Composition: The Takeaway
Same weight, different body composition comes down to three things the scale cannot separate: height, the fat-to-lean mix, and where fat sits. Research on same-height adults shows weight differences are mostly fat on average, lean tissue is denser than fat, and BMI cannot tell the two apart or show distribution. To see the difference at your own numbers, enter your height and weight in our 3D body visualizer, keep the weight fixed, and switch body shape and muscle level to compare the outlines side by side.
Ready to build your AI SaaS?
Fork the template, add your keys, and ship your first feature today.
Get started →Was this helpful?